matplotlib: backend란
matplotlib의 backend 관련자료를 정리한 문서임.
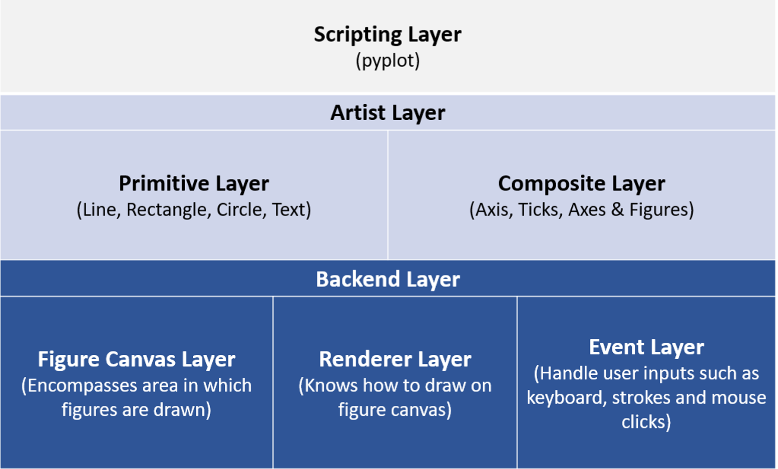
Matplotlib Architecture
Matplotlib 아키텍트는 다음과 같이 크게 3가지 레이어로 구성된다.
- Backend Layer :
- 상위 layer에서 graph를 생성하는데 초점을 두는 것과 달리,
- 생성된 graph를 실제 시스템에서 어떻게 보여줄지(또는 저장할지)를 처리함.
- Artist Layer :
- OOP 를 통해 customization을 수행할 수 있음.
- Scripting Layer :
- scripting을 통해 실제 graph를 그리는 부분.
What is a backend?
Matplotlib는 다양한 환경에서 graph를 표시하고, 다양한 출력 format으로 저장할 수 있음.
일반적으로 matplotlib를 사용하는 경우들을 크게 다음으로 나눌 수 있음.
- Python shell에서 commnad를 입력하여 matplotlib의 graph를 interactive하게 그리는 경우.
- Python shell에서 graph가 그려지는 windows가 띄우게 되며,
- command와 해당 windows의 버튼들을 통해 graph와 상호작용이 가능함.
- 또는 plt.ion() 과 plt.ioff() 등을 통해 interactive하게 그래프를 그릴 수도 있음.
- Jupyter notebooks에서 데이터 분석을 위해 inline plots 을 matplotlib로 그리고 확인하는 경우.
- PyQt or PyGObject를 통해 만들어지는 GUI application에서 graph등을 그리기 위해 matplotlib를 내장시키는 경우.
- 수치해석 분석이나 시뮬레이션 등에서 png, svg등의 postscript image를 생성시키는 batch script로 사용하는 경우.
- django나 flask등으로 구현되는 web application server에서 graph를 그리는 기능을 제공하기 위해서 matplotlib를 도입하는 경우.
위와 같이 다양한 경우들과 다양한 output format을 지원하기 위해 Matplotlib는 각각의 경우에 대한 backend를 제공함.
backend는
artist layer나 scripting layer등에서 생성한 Figure 객체에 대해
실제 시스템 환경에서 display시키기 위해 필요한 처리 또는
output format으로 encoding하기 위해 필요한 처리,
즉, 랜더링을 담당함.
backend는 이러한 렌더링 과정의 핵심으로
자신 고유의 Canvas 와 Renderer 클래스를 제공하여
Figure 객체를 실제 그래픽 환경(GUI, 이미지 파일 등)에 연결하고 시각화함
- 위의 다양한 경우를 위해 사용자가 Figure 객체 등을 만들기 위해 작성하는 coding (artist layer 및 scripting layer에서 coding)은 동일하지만,
- 해당 code를 통해 실제 graph를 1)디스플레이 하거나 2)파일로 저장 하는 등의 여러 경우의 처리는 각 경우마다 다름.
- 이를 backend가 알아서 해준다.
- 이를 matplotlib 용어로 애기하면, 일관된 frontend interface는 유지하면서 다양한 환경 및 출력포맷을 제공 하기 위해 backend를 도입한 것임.
matplotlib의 backend는 다음과 같이 크게 2가지로 나뉨
- user interface backend (PyQt/PySide, PyGObject, Tkinter, wxPython, or macOS/Cocoa등을 사용)
- interactive가 가능한 backend.
- hardcopy backend (PNG, SVG, PDF, PS)
- image file을 생성. "non-interactive backends"라고도 불림.
- static backend라고도 불림.
backend 는 다음으로 구성됨
2024.06.11 - [Python/matplotlib] - [matplotlib] Canvas, Render, and Event : Backend 구성 Layers
[matplotlib] Canvas, Render, and Event : Backend 구성 Layers
Canvas, Render, and Event : Backend 구성 Layers Matplotlib의 backend는 크게FigureCanvas, Renderer, Event layer로 구성되어 있음.2023.07.20 - [Python/matplotlib] - [matplotlib] : backend 란 [matplotlib] : backend 란matplotlib: backend
ds31x.tistory.com
How to list the available backends and the current back end
다음의 코드를 통해 사용가능한 backend 목록을 확인할 수 있음.
import matplotlib.pyplot as plt
import matplotlib

# 사용 가능한 모든 백엔드 목록 확인
print(matplotlib.rcsetup.all_backends)- rcsetup : runtime configuration file setup
- Unix/Linux 시스템에서 프로그램의 설정 파일 이름에 붙는 접미사에서 유래함 (예: .bashrc, .vimrc 등)
- Matplotlib에서 rcsetup 모듈은 matplotlib의 설정 파일(matplotlibrc)과 관련된 기본 파라미터, 유효성 검사 함수, 설정 처리 등을 담당
- graph의 기본 스타일, 글꼴, 색상, 크기
현재의 backend는 다음을 통해 확인 가능함.
import matplotlib

# 현재 사용 중인 백엔드 확인
print(matplotlib.get_backend())
Selecting a backend
다음 3가지 방법으로 matplotlib의 backend를 설정할 수 있음.
- The rcParams["backend"] parameter in your
matplotlibrcfile - The MPLBACKEND environment variable
- The function matplotlib.use( )
위 3가지 방법에서 동일한 항목에 대한 설정이 다르게 존재하는 경우,
리스트에서 마지막 것이 우선권을 가짐(python의 변수 할당과 비슷).
예를 들어 설명하면,matplotlib.use() 는 앞서 두 방식의 설정치를 override함.
참고로 matplotlibrc 파일의 경로는 다음과 같은 방식으로 확인 가능함.
import matplotlib
print(matplotlib.matplotlib_fname())- 보통 가상환경 등의
site-packages/matplotlib/mpl-data/matplotlibrc에 위치.
명시적으로 backend를 지정을 하지 않은 경우엔 matplotlib가 자동으로 사용가능한 backend를 찾아서 사용함.
가장 많이 사용되는 backend list는 다음과 같음.
MacOSXQtAgg***GTK4Agg**Gtk3AggTkAggWxAggAgg**
맨 마지막의 Agg backend (= Anti-Grain Geometry 약자)는
non-interactive backend로
Linux에서 X window 설정 등이 되지 않은 headless 장비에서 주로 사용된다
(file로만 저장시킴. 아래에 좀 더 자세히 다룸).
1.matplotlibrc file의 rcParams["backend"] parameter로 설정하기. : 관련url
backend : qtagg # use pyqt with antigrain (agg) rendering2.MPLBACKEND 환경변수로 설정하기
# Linux
> export MPLBACKEND=qtagg
> python simple_plot.py
# Windows
> set MPLBACKEND=qtagg
> python simple_plot.py3.matplotlib.use() 로 설정하기.
import matplotlib
matplotlib.use('qtagg')
The "builtin" backends
일반적으로는 Matplotlib가 알아서 기본 backend를 설정하지만,
GUI toolkit이 전혀 없는 일부 특수한 linux의 경우엔 python-tk 패키지를 설치해야 함.
사실 backend는 거의 다 알아서 자동으로 처리해주기 때문에
단순히 jupyter notebook등에서 이용하는 경우라면, backend에 대해 그리 신경쓸 필요가 없다.
하지만 GUI application이나 Web application server등에서 matplotlib를 사용할 때에는 좀 더 많은 backend에 대한 이해가 필요.
GUI 등에서 효율적 활용을 위해
Matplotlib는
- 실제 drawing이 이루어지는 canvas 와
- 실제 drawing을 수행하는 renderer를 분리하였다.
일반적으로 user interface를 위한 표준(canonical) renderer는 Agg 임.
Agg는 Anti-Grain Geometry C++ 라이브러리를 사용하여 figure로 raster(pixel) image를 생성함.Agg는QtAgg,GTK4Agg,GTK3Agg,wxAgg,TkAgg, andmacosxbackends에서 사용된다.Agg의 대안으로는Cairolibrary에 기반을 둔 render가 있으며, 이는QtCairo등의 backend 에서 사용됨.
2024.04.29 - [Python/matplotlib] - [Etc] Anti-Grain Geometry (AGG)
[Etc] Anti-Grain Geometry (AGG)
Anti-Grain Geometry (AGG) Anti-Grain Geometry(AGG)는 다음과 같은 특징을 가지는Open-source 고성능 2D 벡터 그래픽 라이브러리임.C++로 구현됨.anti-alising과 sub-pixel 정확도에 중점을 두고고품질의 이미지를 생성
ds31x.tistory.com
참고로, renderer (or rendering engine)는 vector graphics renderer와 raster graphics renderer로 나뉨.
- renderer들은 각각 동일한 이름의 non-interactive backend (or static backend)를 가진다.
- 즉, renderer만 있으면 image file로 저장은 가능함.
Matplotlib에선 지원하는 static renderer는 다음과 같음.
| Renderer | Filetypes | Description |
| AGG ** | png | raster graphics — high quality images using the Anti-Grain Geometry engine. |
| vector graphics — Portable Document Format output. | ||
| PS | ps, eps | vector graphics — PostScript output. |
| SVG | svg | vector graphics — Scalabel Vector Graphics output. |
| PGF | pgf, pdf | vector graphics — using the pdf package. |
| Cairo | png, ps, pdf, svg |
raster or vector graphics — using the Cairo library (requires pycairo or cairocffi ). |
non-interactive backends (or static renderer)를 사용하여 graph를 image file로 저장하는 경우matplotlib.pyplot.savefig('filename') 함수를 사용한다.
아래의 savefig 함수 사용의 예를 참고할 것.
import matplotlib.pyplot as plt
import numpy as np

# 데이터 생성
x = np.linspace(0, 10, 100)
y = np.sin(x)

# 그래프 그리기
plt.figure(figsize=(8, 6))
plt.plot(x, y, 'b-', linewidth=2, label='sin(x)')
plt.title('Sine Wave')
plt.xlabel('x')
plt.ylabel('sin(x)')
plt.grid(True)
plt.legend()

# 파일로 저장하기
plt.savefig('sine_wave.png')  # PNG 형식으로 저장
plt.savefig('sine_wave.pdf')  # PDF 형식으로 저장
plt.savefig('sine_wave.svg')  # SVG 형식으로 저장
plt.savefig('sine_wave.jpg', dpi=300)  # JPG 형식으로 높은 해상도로 저장

# 투명한 배경으로 저장. 주로 png 파일포맷과 사용함.
plt.savefig('sine_wave_transparent.png', transparent=True)

# 테두리 여백 조정하여 저장
plt.savefig('sine_wave_tight.png', bbox_inches='tight')

plt.show() # 화면에도 표시- filename: 저장할 파일 이름 (확장자에 따라 형식 결정)
- dpi: 해상도 (dots per inch)
- transparent: 배경 투명도 설정 (True/False)
- bbox_inches: 그림 주변 여백 설정 ('tight'는 내용에 맞게 조정)
- format: 파일 형식 명시 (확장자로 유추할 수 없을 때)
- quality: JPG 파일의 품질 설정 (0-100)
Interactive backends
interactive backends는
user interface와 renderer의
combination이다.
참고로, Matplotlib가 최초로 지원한 intreactive backends는 GTK기반이었기 때문에, 많은 API가 GTK API와 유사함.
https://matplotlib.org/stable/users/explain/figure/event_handling.html#event-handling-and-picking
Event handling and picking — Matplotlib 3.10.3 documentation
Event handling and picking Matplotlib works with a number of user interface toolkits (wxpython, tkinter, qt, gtk, and macOS) and in order to support features like interactive panning and zooming of figures, it is helpful to the developers to have an API fo
matplotlib.org
[Etc] GTK: GIMP Toolkit
GTK란GTK는 "GIMP Toolkit"을 의미하는 Open source GUI Toolkit입니다. GTK는 원래 GIMP(GNU Image Manipulation Program)의 개발을 위해 만들어진 Open Source Toolkit임.https://www.gtk.org/ The GTK Project - A free and open-source cross-pla
ds31x.tistory.com
Matplotlib에선 지원하는 interactive backends는 다음과 같음.
| Backend | Description |
| QtAgg | Agg rendering in a QT canvas (requires PyQt or Qt for Python, a.k.a. PySide). This backend can be activated in IPython with %matplotlib qt.The Qt binding can be selected via the QT_API environment variable; see Qt Bindings for more details |
| ipympl | nbAgg rendering embedded in a Jupyter widget (requires ipympl). This backend can be enabled in a Jupyter notebook with %matplotlib ipympl. |
| GTK3Agg | Agg rendering to a GTK 3.x canvas (requires PyGObject and pycairo). This backend can be activated in IPython with %matplotlib gtk3. |
| GTK4Agg | Agg rendering to a GTK 4.x canvas requires PyGObject and pycairo). This backend can be activated in IPython with %matplotlib gtk4. |
| macosx | Agg rendering into a Cocoa canvas in OSX. This backend can be activated in IPython with %matplotlib osx. |
| TkAgg | Agg rendering to a Tk canvas (requires TkInter). This backend can be activated in IPython with %matplotlib tk. |
| nbAgg | Embed an interactive figure in a Jupyter classic notebook. This backend can be enabled in Jupyter notebooks via %matplotlib notebook. |
| WebAgg | On show() will start a tornado server with an interactive figure. |
| GTK3Cairo | Cairo rendering to a GTK 3.x canvas (requires PyGObject and pycairo). |
| GTK4Cairo | Cairo rendering to a GTK 4.x canvas (requires PyGObject and pycairo). |
| wxAgg | Agg rendering to a wxWidgets canvas (requires wxPython 4). This backend can be activated in IPython with %matplotlib wx. |
builtin backend의 경우, 이름을 지정할 때 case-insensitive임.
즉 QtAgg and qtagg 가 같은 의미임.
다음 코드를 수행할 경우, 현재 사용가능한 matplotlib의 interactive backend를 확인할 수 있음.
#!/usr/bin/env python
import matplotlib.pyplot as plt
import matplotlib

backends = matplotlib.rcsetup.interactive_bk
# validate backends
backends_valid = []
for b in backends:
    try:
        plt.switch_backend(b)
        backends_valid += [b]
    except:
        continue

print(f'{backends_valid = }')
참고: ipympl (Interactive Python Maplotlib)
Jupyter widget ecosystem 은 워낙 빨리 변화하기 때문에 matplotlib에서 직접 지원하기 어려움.
때문에 ipympl 은 다음의 명령어로 설치하여 사용해야함.
conda install ipympl -c conda-forgeor
pip install ipymplUsing "non-builtin" backends
위에서 설명한 방법(e.g. matplotlib.use 함수)으로 non-builting backend도 사용하도록 지정가능함.
단, 해당 backend가 matplotlig에서 import 가능하도록 구현이 되어야 함.
backend 구현에 대한 보다 자세한 내용은 다음 URL을 참고할 것 : Writing a backend -- the pyplot interface.
backend를 포함하는 module이 name.of.the.backend 라면
backend 이름으로 module://name.of.the.backend를 사용할 것.
예를 들면 matplotlib.use('module://name.of.the.backend')와 같은 형태임.
대표적인 예로는 colab에서 matplotlib.get_backend()를 수행하면 나오는 백엔드임:

References
https://matplotlib.org/stable/users/explain/backends.html#interactive-backends
Backends — Matplotlib 3.7.2 documentation
The builtin backends By default, Matplotlib should automatically select a default backend which allows both interactive work and plotting from scripts, with output to the screen and/or to a file, so at least initially, you will not need to worry about the
matplotlib.org
https://kongdols-room.tistory.com/78
Matplotlib의 backend(백엔드) - matplotlib(3)
파이썬 버전 3.7 기준matplotlib 버전 3.0.3 기준 Matplotlib에서의 backend(백엔드) 본 포스팅에서는 Matplotlib에서 사용될 수 있는 backend에 대해 다룬다. Backend란? 웹사이트와 메일링 리스트의 많은 자료에
kongdols-room.tistory.com
'Python > matplotlib' 카테고리의 다른 글
| [matplotlib] x축과 y축을 그리기: spines (0) | 2023.08.08 |
|---|---|
| [matplotlib] line 및 marker 설정하기. (3) | 2023.07.21 |
| [matplotlib]: Figure and Axes (0) | 2023.07.20 |
| [Python] matplotlib : Axis Scale and Ticks (1) | 2023.07.14 |
| [matplotlib] : Styling Artists and Labeling Plots (0) | 2023.07.14 |


