Layout Managers: GridSpec and subplot2grid
Matplotlib에서 여러 graph에 해당하는 Axes 객체들을 하나의 Figure객체에 포함시킬 경우,
이들을 어떻게 배치할지를 정해줘야 한다.
plt.subplots 을 사용할 경우, 행과 열을 지정하지만 모두 같은 크기를 차지한다.GridSpec과 Subplot2grid는 grid형태로 Axes객체들을 배치하지만, 이들의 크기가 각각 다르게 할 수 있다.
배치의 자유도가 큰 순으로 나열하면,
GridSpec이 가장 복잡한 형태의 layout을 가능하게 하나, 가장 설정이 귀찮고plt.subplot2grid가 중간 정도에 위치하고plt.subplots가 가장 단순한 layout이 되지만, 가장 쓰기는 간단함.
GridSpec
matplotlib.gridspec 모듈의 class GridSpec은
- figure를 그리드로 나누고,
- 다른 크기의 행과 열로
Axes객체들을 배치한다.
다음 code는 GridSpec을 layout manager로 삼아 배치하는 방법을 보여줌.
from matplotlib.gridspec import GridSpec
import matplotlib.pyplot as pl

fig = plt.figure(figsize=(8,8))
lm = GridSpec(5,5)
axs = []
ax0 = fig.add_subplot(lm[0,0])
ax0.set_title('ax0')
axs.append(ax0)

ax1 = fig.add_subplot(lm[0,1:-1])
ax1.set_title('ax1')
axs.append(ax1)

ax2 = fig.add_subplot(lm[0,-1:])
ax2.set_title('ax2')
axs.append(ax2)

ax3 = fig.add_subplot(lm[1:,0])
ax3.set_title('ax3')
axs.append(ax3)

ax4 = fig.add_subplot(lm[1,1:3])
ax4.set_title('ax4')
axs.append(ax4)

ax5 = fig.add_subplot(lm[1:,3:])
ax5.set_title('ax5')
axs.append(ax5)

ax6 = fig.add_subplot(lm[2:,1:3])
ax6.set_title('ax6')
axs.append(ax6)

for c in axs:
    c.set_xticks([]); c.set_yticks([])
결과는 다음과 같음.

앞서의 경우, 동일한 크기의 셀로 나누고 이들 여러개를 차지하는 형태로 배치한 것이고
다음과 같이 width_ratio와 height_ratio를 이용하여 상대적인 차이를 가진 셀들로 구성할 수도 있음.
from matplotlib.gridspec import GridSpec
import matplotlib.pyplot as pl

widths  = [ 2, 3, 1]
heights = [ 2, 4 ]

fig = plt.figure(figsize=(7,7))

lm = GridSpec(2,3,
              width_ratios=widths,
              height_ratios=heights)

# lm = fig.add_gridspec(
#      nrows=23
#      ncols=3,
#      width_ratios = widths,
#      height_ratios = heights,
# )

axs = []
for i in range(len(widths)* len(heights)):
    ax = fig.add_subplot(
        lm[i//len(widths), i % len(widths)]
    )
    ax.set_xticks([]); ax.set_yticks([])
    ax.set_title(f'ax{i}')
    axs.append(ax)
결과는 다음과 같음.
GridSpec 객체를 생성할 때, wspace 와 hspace를 주어 여백을 설정할 수도 있음 (일반적으로 0.05 같은 작은 값을 입력)
plt.subplot2grid
matplotlib.pyplot 모듈(plt)의 subplot2grid는 여러 행과 열을 span하는 Axes 객체들을 배열할 수 있음.
HTML에서 table을 생성할 때와 비슷함.
plt.subplot2grid는 다음과 같은 paramers를 통해 Axes 객체를 생성하여 반환함.
- 1st positional parameter:
tuple로 지정되며, figure의 전체 행과 열을 나타냄.
(가장 작은 크기면서 같은 크기로 나눈 경우의 행과 열) - 2nd positional parameter:
tuple로 지정되며, 반환될Axes객체가 어디에 추가될지를 나타냄. 왼쪽 상단의 시작위치라고 생각하면 됨 (첫번째 파라메터로 지정된 같은 크기의 셀로 구성된 행과 열을 기반으로 지정) colspan: 반환될Axes객체가 차지할 열의 수를 지정.rowspan: 반환될Axes객체가 자지할 행의 수를 지정.
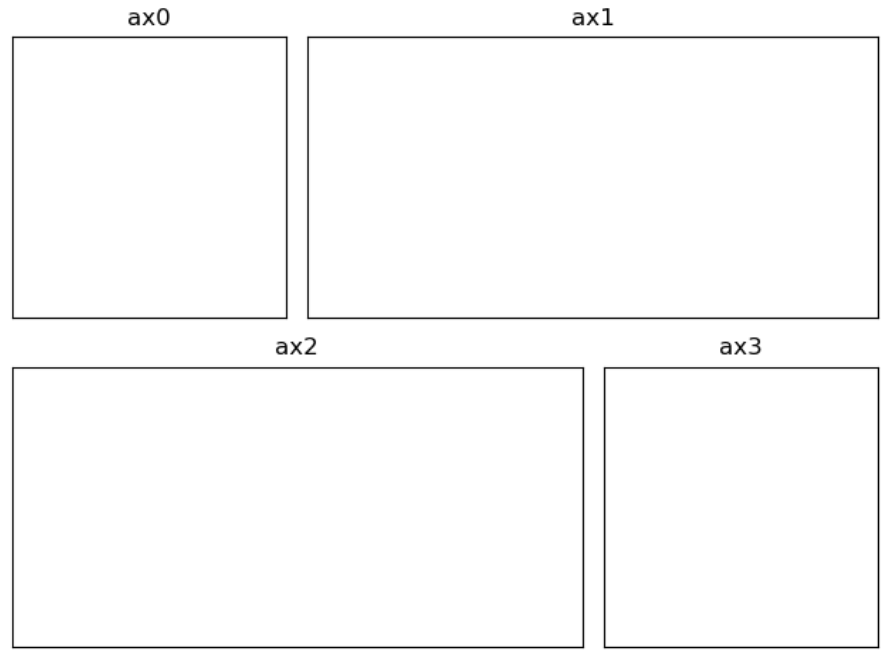
다음은 사용법을 간단히 살펴볼 수 있는 code snippet임.
import matplotlib.pyplot as plt

# 서브플롯 추가 (2행 3열 그리드)
ax0 = plt.subplot2grid((2, 3), (0, 0)) # 첫 번째 행, 첫 번째 열
ax1 = plt.subplot2grid((2, 3), (0, 1), colspan=2) # 첫 번째 행, 두 번째 열부터 2열 사용
ax2 = plt.subplot2grid((2, 3), (1, 0), colspan=2) # 두 번째 행, 첫 번째 열부터 2열 사용
ax3 = plt.subplot2grid((2, 3), (1, 2)) # 두 번째 행, 세 번째 열

# 각 서브플롯에 제목 설정
ax0.set_title('ax0')
ax0.set_xticks([]); ax0.set_yticks([])
ax1.set_title('ax1')
ax1.set_xticks([]); ax1.set_yticks([])
ax2.set_title('ax2')
ax2.set_xticks([]); ax2.set_yticks([])
ax3.set_title('ax3')
ax3.set_xticks([]); ax3.set_yticks([])

plt.tight_layout()
plt.show()
결과는 다음과 같음.

같이 읽어보면 좋은 자료들
2024.06.03 - [Python/matplotlib] - [matplotlib] Summary : 작성중
[matplotlib] Summary : 작성중
Introduction2024.03.04 - [Python/matplotlib] - [matplotlib] matplotlib란 [matplotlib] matplotlib란Matplotlib은 Python에서 가장 널리 사용되는 Data Visualization Library임. matplotlib를 통해 chart(차트), image(이미지) 및, 다양한 vi
ds31x.tistory.com
'Python > matplotlib' 카테고리의 다른 글
| [matplotlib] Visualization: Graph, Chart, Diagram, Figure (1) | 2024.01.22 |
|---|---|
| [matplotlib] pseudocolor plot: pcolor (1) | 2024.01.22 |
| [matplotlib] 3D Plot (0) | 2024.01.21 |
| [matplotlib] x축과 y축을 그리기: spines (0) | 2023.08.08 |
| [matplotlib] line 및 marker 설정하기. (0) | 2023.07.21 |


